Prueba representar e interpretar datos
ProfeCoins 5
Downloads count 17
Resource type Assessment
Recommended age 8 - 9 years
File information docx, 2 pages, 388 KB
Download
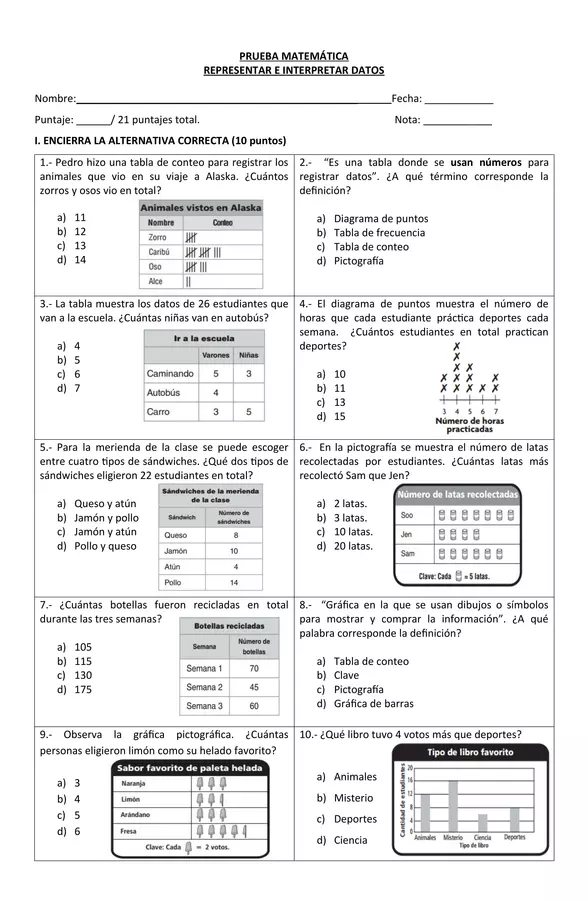
En esta evaluación sobre la unidad representar e interpretar datos, se puede evaluar los siguientes indicadores:
- Organizar datos obtenidos en tablas y visualizarlos en gráficos de barra.
- Construir, leer e interpretar pictogramas y gráficos de barras simple en base a información dada. 

There are no comments yet, write one yourself!

Prueba multiplicación Prueba multiplicación
ProfeCoins 10
Downloads count 11
Resource type Assessment
Recommended age 7 - 9 years
File information pdf, 5 pages, 1010 KB
Download
Evaluación de segundo básico que contiene ejercicios de:
- Multiplicación con suma iterada
- Resolución de multiplicaciones de forma pictórica y simbólica.
- Resolución de problemas paso a paso
- Contar y completar
- Gráfico de barras

There are no comments yet, write one yourself!

GRÁFICOS DE BARRA SIMPLE Y PICTOGRAMA GRÁFICOS DE BARRA SIMPLE Y PICTOGRAMA GRÁFICOS DE BARRA SIMPLE Y PICTOGRAMA GRÁFICOS DE BARRA SIMPLE Y PICTOGRAMA GRÁFICOS DE BARRA SIMPLE Y PICTOGRAMA
ProfeCoins 5
Downloads count 34
Resource type Lesson
Recommended age 8 - 12 years
File information pdf, 17 pages, 16 MB
Comments count 4
Download
Hola a todos y todas! En esta oportunidad les comparto un archivo pdf sobre gráficos de barra simple y pictogramas, utilizado en cuarto año básico. Incluye conceptualizaciones básicas, imágenes y desafíos para los estudiantes. Así que espero les guste y sirva, cariños! 
Gráficas de barras Gráficas de barras
ProfeCoins 10
Downloads count 1
Resource type Lesson
Recommended age 8 - 10 years
File information pptx, 5 pages, 2.01 MB
Download
Clase creada para estudiantes de 4to año de educación básica .
OBJETIVO:RECOLETE , ORGANICE Y COMPRENDA DATOS RELATIVOS A SU ENTORNO , REPRESENTARLOS EN GRÁFICAS DE BARRAS E INTERPRETAR Y EXPLICAR CONCLUSIONES .


There are no comments yet, write one yourself!

Loading more posts ...