
ProfeCoins  8
8
8| Tipo de recurso | Guía de trabajo |
| Edad recomendada | 8 - 10 años |
| Info. del archivo | pdf, 6 páginas, 603 KB |
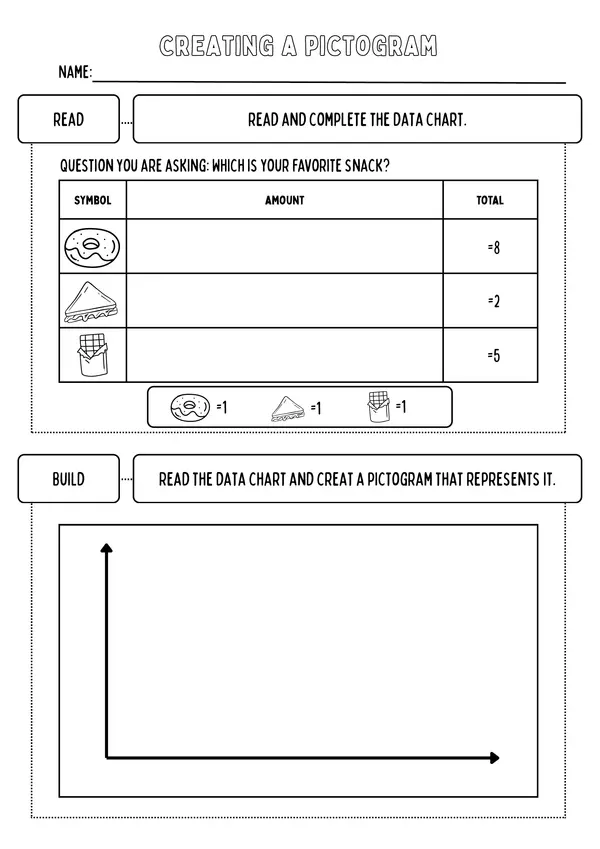
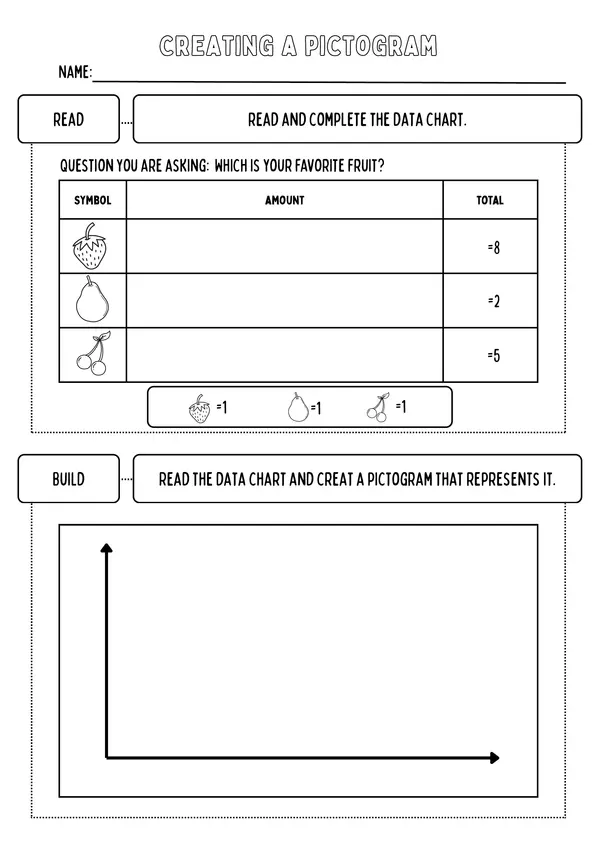
In this activity, students learned how to organize and represent information using pictograms and bar graphs. As a class, students collected data on a familiar topic (such as favorite animals, sports, or school activities).
They first created a pictogram using symbols to show quantities, ensuring that each symbol represented one item or a fixed amount. After completing the pictogram, students used the same data to build a bar graph, identifying the categories and comparing the heights of the bars.
Through this activity, students practiced interpreting visual information, answering questions about which categories had the most or the least items, and explaining their observations using simple mathematical vocabulary.
Mathematics OA:
- OA 17: Collect, organize, and represent data using pictograms and simple bar graphs.
- OA 18: Interpret pictograms and bar graphs to answer questions about quantities, comparisons (more/less), and simple conclusions.
English OA (if activity is done in English):
- OA 03: Demonstrate understanding of simple oral and written instructions related to classroom tasks.
- OA 05: Use simple words and phrases to describe quantities, categories, and comparisons (e.g., more, fewer, equal).
Social Studies OA (optional):
- OA 02: Recognize characteristics of their class and school community by gathering and comparing information about classmates.


 5
5
No hay comentarios aún, ¡escribe uno!